Pi-hole Logs in the HELK Stack
Getting started
The purpose of this tutorial is to extend the HELK stack to ingest pi-hole log data. This tutorial can easily extend data ingestion to any custom data that we would need to monitor in our environments.
The use of pi-hole is to stop ads at the DNS level, effectively cutting potential infection and compromization via malicious ads. This tactic additionally reduces the amount of data that is collected and tracked by blocking ad tracking domains such as Facebook Pixel and Google AdWords.
Why we chose pi-hole for our introduction to DNS filtering and blocking is the simplicity to get it running, the low cost of deployment (a Raspberry Pi or a small VM or docker container), and the large community support for the project.
Requirements
- HELK Stack - https://github.com/Cyb3rWard0g/HELK/
- Pi-hole - https://pi-hole.net/
**This document will not cover the installation of these software infrastructures
Installing Filebeat on the Pi-hole OS
This document will cover a Debian based installation, if you are not running a Debian based installation go to Elastic’s Filebeat documentation and follow the proper installation for your particular flavor of Linux, MacOS, or Windows
https://www.elastic.co/guide/en/beats/filebeat/current/filebeat-installation-configuration.html
**This documentation will be for Filebeat 7.9.2 this may be dated by the time you read it, if so follow the above link for current documentation.
Install Filebeat
Open the Terminal and enter the following commands to add the Elastic company’s repository to your Debian installation.
wget -qO - https://artifacts.elastic.co/GPG-KEY-elasticsearch | sudo apt-key add -
You may need to install the apt-transport-https package of Debian so double-check to see if either you have it but if you don’t then install it.
sudo apt-get install apt-transport-https
Run apt update to pull down the package list and update your repository to reflect that we just added the Elastic repo. Then install Filebeat. You can accomplish both by running these commands.
sudo apt update -y && sudo apt install filebeat -y
Configure Filebeat to start automatically during boot.
sudo systemctl enable filebeat
Filebeat should be installed now.
Customizing Filebeat for collecting Pi-hole logs
The pi-hole stores longterm query data inside of a sqlite database and for the intents of this article we will not be going over how to import longterm or historical pi-hole data into our Logstash environment, not yet at least. What we will be collecting is current and future pi-hole traffic.
To collect pi-hole traffic we will want to monitor the pihole.log log file. This file is located in the following location /var/log/pihole.log . This log file will have all of the queried domains, ip addresses, blocked domains, etc. essentially all of the data we want to ingest.
To start monitoring this data we will want to edit our filebeat.yml file. The file can be found in the following location: /etc/filebeat/filebeat.yml.
Replace or update your current filebeat.yml file with the following configuration.
**Replace the tags sections with the specific tags you would like BUT keep the pihole tag for our Logstash filtering process for later.
**Replace both the Kibana and Logstash host location with your relevant host location. HELK specific examples are provided in within this example filebeat configuration file
###################### Filebeat Configuration Example #########################

# This file is an example configuration file highlighting only the most common
# options. The filebeat.reference.yml file from the same directory contains all the
# supported options with more comments. You can use it as a reference.
#
# You can find the full configuration reference here:
# https://www.elastic.co/guide/en/beats/filebeat/index.html

# For more available modules and options, please see the filebeat.reference.yml sample
# configuration file.

# ============================== Filebeat inputs ===============================

filebeat.inputs:

# Each - is an input. Most options can be set at the input level, so
# you can use different inputs for various configurations.
# Below are the input specific configurations.

- type: log

  # Change to true to enable this input configuration.
  enabled: true

  # Paths that should be crawled and fetched. Glob based paths.
  paths:
    - /var/log/pihole.log
    #- c:\programdata\elasticsearch\logs\*

  # Exclude lines. A list of regular expressions to match. It drops the lines that are
  # matching any regular expression from the list.
  #exclude_lines: ['^DBG']

  # Include lines. A list of regular expressions to match. It exports the lines that are
  # matching any regular expression from the list.
  #include_lines: ['^ERR', '^WARN']

  # Exclude files. A list of regular expressions to match. Filebeat drops the files that
  # are matching any regular expression from the list. By default, no files are dropped.
  #exclude_files: ['.gz$']

  # Optional additional fields. These fields can be freely picked
  # to add additional information to the crawled log files for filtering
  fields:
    level: debug
  #  review: 1

  ### Multiline options

  # Multiline can be used for log messages spanning multiple lines. This is common
  # for Java Stack Traces or C-Line Continuation

  # The regexp Pattern that has to be matched. The example pattern matches all lines starting with [
  #multiline.pattern: ^\[

  # Defines if the pattern set under pattern should be negated or not. Default is false.
  #multiline.negate: false

  # Match can be set to "after" or "before". It is used to define if lines should be append to a pattern
  # that was (not) matched before or after or as long as a pattern is not matched based on negate.
  # Note: After is the equivalent to previous and before is the equivalent to to next in Logstash
  #multiline.match: after

# ============================== Filebeat modules ==============================

filebeat.config.modules:
  # Glob pattern for configuration loading
  path: ${path.config}/modules.d/*.yml

  # Set to true to enable config reloading
  reload.enabled: false

  # Period on which files under path should be checked for changes
  #reload.period: 10s

# ======================= Elasticsearch template setting =======================

setup.template.settings:
  index.number_of_shards: 1
  #index.codec: best_compression
  #_source.enabled: false
setup.template.name: "logs-dns-pihole"
setup.template.pattern: "logs-dns-pihole-*"

# ================================== General ===================================

# The name of the shipper that publishes the network data. It can be used to group
# all the transactions sent by a single shipper in the web interface.
#name:

# The tags of the shipper are included in their own field with each
# transaction published.
tags: ["pihole", "additional tags", "tags that could be specific to a certain locations"]

# Optional fields that you can specify to add additional information to the
# output.
#fields:
#  env: staging

# ================================= Dashboards =================================
# These settings control loading the sample dashboards to the Kibana index. Loading
# the dashboards is disabled by default and can be enabled either by setting the
# options here or by using the `setup` command.
#setup.dashboards.enabled: false

# The URL from where to download the dashboards archive. By default this URL
# has a value which is computed based on the Beat name and version. For released
# versions, this URL points to the dashboard archive on the artifacts.elastic.co
# website.
#setup.dashboards.url:

# =================================== Kibana ===================================

# Starting with Beats version 6.0.0, the dashboards are loaded via the Kibana API.
# This requires a Kibana endpoint configuration.
setup.kibana:

  # Kibana Host
  # Scheme and port can be left out and will be set to the default (http and 5601)
  # In case you specify and additional path, the scheme is required: http://localhost:5601/path
  # IPv6 addresses should always be defined as: https://[2001:db8::1]:5601
  # HELK does not expose :5601 as a domain location, it uses nginx to host the site at :80 or :443
  # host: "example.com/app/kibana"
  host: "YOUR HOST DOMAIN/IP ADDRESS AND PORT FOR KIBANA"

  # Kibana Space ID
  # ID of the Kibana Space into which the dashboards should be loaded. By default,
  # the Default Space will be used.
  #space.id:

# =============================== Elastic Cloud ================================

# These settings simplify using Filebeat with the Elastic Cloud (https://cloud.elastic.co/).

# The cloud.id setting overwrites the `output.elasticsearch.hosts` and
# `setup.kibana.host` options.
# You can find the `cloud.id` in the Elastic Cloud web UI.
#cloud.id:

# The cloud.auth setting overwrites the `output.elasticsearch.username` and
# `output.elasticsearch.password` settings. The format is `<user>:<pass>`.
#cloud.auth:

# ================================== Outputs ===================================

# Configure what output to use when sending the data collected by the beat.

# ---------------------------- Elasticsearch Output ----------------------------
# output.elasticsearch:
  # Array of hosts to connect to.
  # hosts: ["localhost:9200"]

  # Protocol - either `http` (default) or `https`.
  #protocol: "https"

  # Authentication credentials - either API key or username/password.
  #api_key: "id:api_key"
  #username: "elastic"
  #password: "changeme"

# ------------------------------ Logstash Output -------------------------------
output.logstash:
  # The Logstash hosts
  # hosts: ["example.com:5044"]
  hosts: ["YOUR HOST DOMAIN/IP ADDRESS AND PORT FOR LOGSTASH:5601"]

  # Optional SSL. By default is off.
  # List of root certificates for HTTPS server verifications
  #ssl.certificate_authorities: ["/etc/pki/root/ca.pem"]

  # Certificate for SSL client authentication
  #ssl.certificate: "/etc/pki/client/cert.pem"

  # Client Certificate Key
  #ssl.key: "/etc/pki/client/cert.key"

# ================================= Processors =================================
processors:
  - add_host_metadata:
      when.not.contains.tags: forwarded
  - add_cloud_metadata: ~
  - add_docker_metadata: ~
  - add_kubernetes_metadata: ~

# ================================== Logging ===================================

# Sets log level. The default log level is info.
# Available log levels are: error, warning, info, debug
#logging.level: debug

# At debug level, you can selectively enable logging only for some components.
# To enable all selectors use ["*"]. Examples of other selectors are "beat",
# "publish", "service".
#logging.selectors: ["*"]

# ============================= X-Pack Monitoring ==============================
# Filebeat can export internal metrics to a central Elasticsearch monitoring
# cluster.  This requires xpack monitoring to be enabled in Elasticsearch.  The
# reporting is disabled by default.

# Set to true to enable the monitoring reporter.
#monitoring.enabled: false

# Sets the UUID of the Elasticsearch cluster under which monitoring data for this
# Filebeat instance will appear in the Stack Monitoring UI. If output.elasticsearch
# is enabled, the UUID is derived from the Elasticsearch cluster referenced by output.elasticsearch.
#monitoring.cluster_uuid:

# Uncomment to send the metrics to Elasticsearch. Most settings from the
# Elasticsearch output are accepted here as well.
# Note that the settings should point to your Elasticsearch *monitoring* cluster.
# Any setting that is not set is automatically inherited from the Elasticsearch
# output configuration, so if you have the Elasticsearch output configured such
# that it is pointing to your Elasticsearch monitoring cluster, you can simply
# uncomment the following line.
#monitoring.elasticsearch:

# ============================== Instrumentation ===============================

# Instrumentation support for the filebeat.
#instrumentation:
    # Set to true to enable instrumentation of filebeat.
    #enabled: false

    # Environment in which filebeat is running on (eg: staging, production, etc.)
    #environment: ""

    # APM Server hosts to report instrumentation results to.
    #hosts:
    #  - http://localhost:8200

    # API Key for the APM Server(s).
    # If api_key is set then secret_token will be ignored.
    #api_key:

    # Secret token for the APM Server(s).
    #secret_token:

# ================================= Migration ==================================

# This allows to enable 6.7 migration aliases
#migration.6_to_7.enabled: true
Restart the Filebeat service to make sure the new configuration is being used properly.
sudo systemctl restart filebeat
Now our pi-hole should be using the new configuration and setup to start sending pi-hole data to our HELK Logstash instance.
Configuring HELK Logstash to ingest Pi-hole logs
This section will assume the default HELK installation, however, there shouldn’t an issue to modify or tweak some settings to apply to your own Logstash environment.
Creating the Pi-hole configuration file
Navigate to HELK/docker/helk-logstash/pipeline this is where we will add our custom configuration files. This location will be reflected within our helk-logstash container at build time.
First we will want to create a file called 0100-dns-pihole.conf there is no particular naming reason why I chose this number just looked like a solid order to place it in.
Next we will want to add the following contents to our 0100-dns-pihole.conf file. Use your favorite command line editor to edit the file.
**Some of the patterns to match are commented out for the sake of my own personal environments being on the latest version of pi-hole and the commented out queries don’t particularly apply to the latest version.
# HELK pihole dns conf file
# HELK build Stage: Alpha
# Author: Colin Rubbert (@colinrubbert)
# License: GPL-3.0

input {
  beats {
    port => 5044
  }
}

filter {

  if "pihole" in [tags] {
    grok {
      patterns_dir => ["${LS_HOME}/pipeline/patterns"]
      match => {
        "message" => [

          # request - query type
          "^%{DNSMASQPREFIX} query\[%{DATA:query_type}\] %{FQDN:domain_request} from %{IP:request_from}$",

          # reponse domain to ip
          "^%{DNSMASQPREFIX} reply %{FQDN:domain_request} is %{IP:ip_response}$",

          # response domain is NXDOMAIN
          "^%{DNSMASQPREFIX} reply %{FQDN:domain_request} is NXDOMAIN$",

          # response config domain is NXDOMAIN
          # "^%{DNSMASQPREFIX} config %{FQDN:domain_request} is NXDOMAIN$",

          # response config domain is no - DATA
          # "^%{DNSMASQPREFIX} config %{FQDN:domain_request} is NODATA-IPv[4,6]$",

          # reponse domain to ip cname
          "^%{DNSMASQPREFIX} reply %{FQDN:domain_request} is \<CNAME\>$",

          # respone ip to domain
          "^%{DNSMASQPREFIX} reply %{IP:ip_request} is %{FQDN:domain_response}$",

          # piholed
          # "^%{DNSMASQPREFIX} \/etc\/pihole\/gravity\.list %{FQDN:blocked_domain} is %{IP:pihole}$",

          # piholed 5.0
          "^%{DNSMASQPREFIX} gravity blocked %{FQDN:blocked_domain} is %{IP:pihole}$",

          # piholed local
          # "^%{DNSMASQPREFIX} \/etc\/pihole\/local\.list %{FQDN:blocked_domain} is %{IP:pihole}$",

          # piholed CNAME inspection
          # "^%{DNSMASQPREFIX} reply %{FQDN:domain_request} is blocked during CNAME inspection",

          # blacklist
          # "^%{DNSMASQPREFIX} \/etc\/pihole\/black\.list %{FQDN:blocked_domain} is %{IP:pihole}$",

          # regex
          # "^%{DNSMASQPREFIX} \/etc\/pihole\/regex\.list %{FQDN:blocked_domain} is %{IP:pihole}$",

          # reverse response etc hosts ip to domain
          # "^%{DNSMASQPREFIX} \/etc\/hosts %{IP:ip_request} is %{FQDN:domain_response}$",

          # reverse response etc hosts domain to ip
          # "^%{DNSMASQPREFIX} \/etc\/hosts %{FQDN:domain_request} is %{IP:ip_response}$",

          # forward dns to
          "^%{DNSMASQPREFIX} forwarded %{FQDN:domain_request_forward} to %{IP:dns_forward_to}$",

          # cached domain to ip
          "^%{DNSMASQPREFIX} cached %{FQDN:domain_request} is %{IP:ip_response}$",

          # cached ip to domain
          # "^%{DNSMASQPREFIX} cached %{IP:ip_request} is %{FQDN:domain_response}$",

          # cached is srv
          # "^%{DNSMASQPREFIX} cached %{SRV} is \<SRV\>$",

          # response is srv
          # "^%{DNSMASQPREFIX} reply %{SRV} is \<SRV\>$",

          # cached domain to ip cname
          "^%{DNSMASQPREFIX} cached %{FQDN:domain_request} is \<CNAME\>$",

          # cached domain is NXDOMAIN
          "^%{DNSMASQPREFIX} cached %{FQDN:domain_request} is NXDOMAIN$",

          # cached domain is no - DATA
          "^%{DNSMASQPREFIX} cached %{FQDN:domain_request} is NODATA-IPv[4,6]$",

          # cached domain is no - DATA
          "^%{DNSMASQPREFIX} cached %{FQDN:domain_request} is NODATA$",

          # domain is no - DATA
          "^%{DNSMASQPREFIX} reply %{FQDN:domain_request} is NODATA-IPv[4,6]$",

          # domain is no - DATA
          "^%{DNSMASQPREFIX} reply %{FQDN:domain_request} is NODATA$",

          # exactly blacklisted
          "^%{DNSMASQPREFIX} exactly blacklisted %{FQDN:blocked_domain} is %{IP:pihole}$",

          # regex blacklisted
          "^%{DNSMASQPREFIX} regex blacklisted %{FQDN:blocked_domain} is %{IP:pihole}$",

          # PTR - delete ?
          # "^%{DNSMASQPREFIX} query\[%{WORD:query_type}\] %{HOSTNAMEPTR:request} from %{IP:request_from}$",

          # PTR forwarded - delete ?
          # "^%{DNSMASQPREFIX} forwarded %{HOSTNAMEPTR:request} to %{IP:dns_forward_to}$",

          # clients sending url instead of domain
          # "^%{DNSMASQPREFIX} (query\[.*\]|config|forwarded|reply|cached) %{URI:URI}.*$",

          # SERVFAIL
          "^%{DNSMASQPREFIX} reply error is SERVFAIL"

        ]
      }
    }

    # to do cached and cached reverse

    if [message] =~ "cached"
    and [message] =~ "NXDOMAIN" {
      mutate {
        add_tag => ["cached NXDOMAIN"]
      }
    }

    else if [NODATA] {
      mutate {
        add_tag => ["NODATA"]
      }
    } else if [request_from] and [message] =~ "query" {
      mutate {
        add_tag => ["request and query type"]
      }
    }

    else if [ip_response] and [message] =~ "reply" {
      geoip {
        source => "ip_response"
      }
      mutate {
        add_tag => ["response domain to ip"]
      }
    }

    else if [message] =~ "CNAME"
    and [message] =~ "reply" {
      mutate {
        add_tag => ["response domain to ip CNAME"]
      }
    }

    else if [domain_response] and [message] =~"reply" {
      mutate {
        add_tag => ["response ip to domain"]
      }
      geoip {
        source => "ip_request"
      }
    }

    else if [blocked_domain] {
      mutate {
        add_tag => ["piholed"]
      }
    } else if [message] =~ "\/etc\/hosts" {
      mutate {
        add_tag => ["reverse hostsfile"]
      }
    } else if [dns_forward_to] {
      mutate {
        add_tag => ["dns forward"]
      }
    } else if [ip_request] and [message] =~ "cached" {
      mutate {
        add_tag => ["cached ip to domain"]
      }
      geoip {
        source => "ip_request"
      }
    }

    else if [domain_request] and [message] =~ "cached"
    and [message] =~ "CNAME" {
      mutate {
        add_tag => ["cached domain to ip cname"]
      }
    }

    else if [domain_request] and [message] =~ "cached" {
      mutate {
        add_tag => ["cached domain to ip"]
      }
      geoip {
        source => "ip_response"
      }
    }

    if [domain_request] {
      geoip {
        # cache_size => "10000"
        source => "domain_request"
      }
    }

    if [ip_response] {
      mutate {
        add_field => {
          "ip_or_domain_response" => "%{domain_request}"
        }
      }
    }

    if [domain_response] {
      mutate {
        add_field => {
          "ip_or_domain_response" => "%{domain_response}"
        }
      }
    }

    if [blocked_domain] {
      mutate {
        add_field => {
          "ip_or_domain_response" => "%{blocked_domain}"
        }
      }
    }

    mutate {
      add_field => {
        "[source_fqdn]" => "%{source_host}"
      }
    }

    mutate {
      remove_field => ["port"]
    }

    dns {
      nameserver => "localhost"
      reverse => ["source_fqdn"]
      action => "replace"
      hit_cache_size => 10000
      hit_cache_ttl => 900
      failed_cache_size => 512
      failed_cache_ttl => 900
    }

    date {
      match => ["date", "MMM  d HH:mm:ss", "MMM dd HH:mm:ss"]
      timezone => "America/Chicago"
    }

  }

  if "%" in [source_host] {
    mutate {
      gsub => [
        "source_host", "%.*$", ""
      ]
    }
  }

}

output {
# stdout { codec => rubydebug }
  if "pihole" in [tags]{
    elasticsearch {
      hosts => ["helk-elasticsearch:9200"]
      manage_template => true
      index => "logs-dns-pihole-%{+YYYY.MM.dd}"
      user => 'elastic'
      #password => 'elasticpassword'
    }
  }
}
Our configuration file is now done but before we restart our helk-logstash instance we need to create a custom pattern since our configuration file uses custom variables for the filtering process.
Creating a custom pattern for our dns-pihole configuration
HELK out of the box doesn’t have a spot for you to place your custom configurations but since we know that the pipeline directory will be reflected at build time of our docker container we can make a custom folder within our pipeline directory for our custom patterns.
To create our custom folder in our pipeline file we will need to make a new folder. We should already be in our HELK/docker/helk-logstash/pipeline folder.
# From the HELK/docker/helk-logstash/pipeline directory
mkdir patterns
Moving to our new directory we will need to make our file for our custom pattern and we will name it dns-pihole to do this we will run the following command.
# From the HELK/docker/helk-logstash/pipeline/patterns directory
touch dns-pihole
Next we will want to edit our dns-pihole file with our custom pattern. Edit the file and add the following custom variable patterns.
# dns-pihole pattern
HOSTNAMEPTR \b(?:[\._0-9A-Za-z][0-9A-Za-z-]{0,62})(?:\.(?:[\._0-9A-Za-z][0-9A-Za-z-]{0,62}))*(\.?|\b)
NODATA NODATA-[[:word:]]+
SRV _+.+\S
FQDN \b(?:[\w-][\w-]{0,62})(?:\.(?:[\w-][\w-]{0,62}))*(\.?|\b)
DNSMASQPREFIX %{SYSLOGTIMESTAMP:date} %{SYSLOGPROG}: %{INT:logrow} %{IP:source_host}\/%{POSINT:source_port}
URI %{URIPROTO}:(//)?(?:%{URIHOST})?(?:%{URIPATH})?
Now we will have to restart our helk-logstash container to rebuild our custom pi-hole configuration.
# Restart helk-logstash docker container
sudo docker restart helk-logstash
Now if everything is working we should be ingesting our Pi-hole logs into our HELK Logstash endpoint.
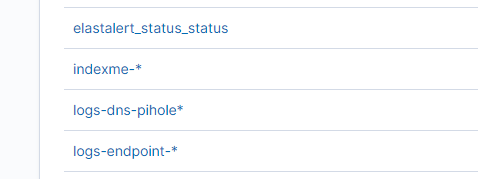
We should now see an options for logs-dns-pihole* index pattern in our HELK Kibana instance.
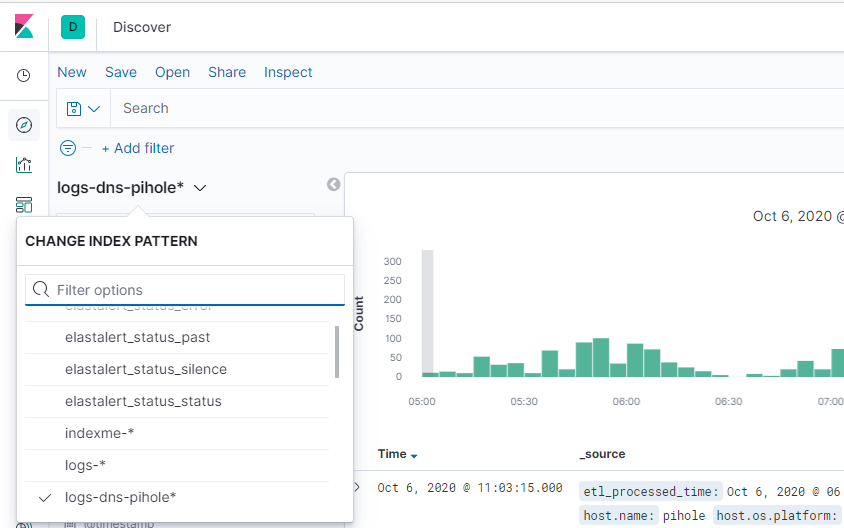
If it’s not there you may have to go into your management page and look and see if it’s present in your Kibana index patterns, if it’s not in your index patterns check and see if there are any logs that are indicating that there is an error anywhere.
Conclusion
The HELK project is a fantastic out of the box logging infrastructure and extending the ingestion and collection of your data and providing new data sources with custom patterns is fairly easy once you know how to do it.
As with any project, your mileage may vary, but the resources for the ELK stack as well as the HELK Github repository are valuable resources to troubleshoot any issues.
This article focuses on the pi-hole, however, applying these steps could be easily be applied to other custom data points for extending your logs.